The Bored and Brilliant Challenge

And why data professionals need to be creative.

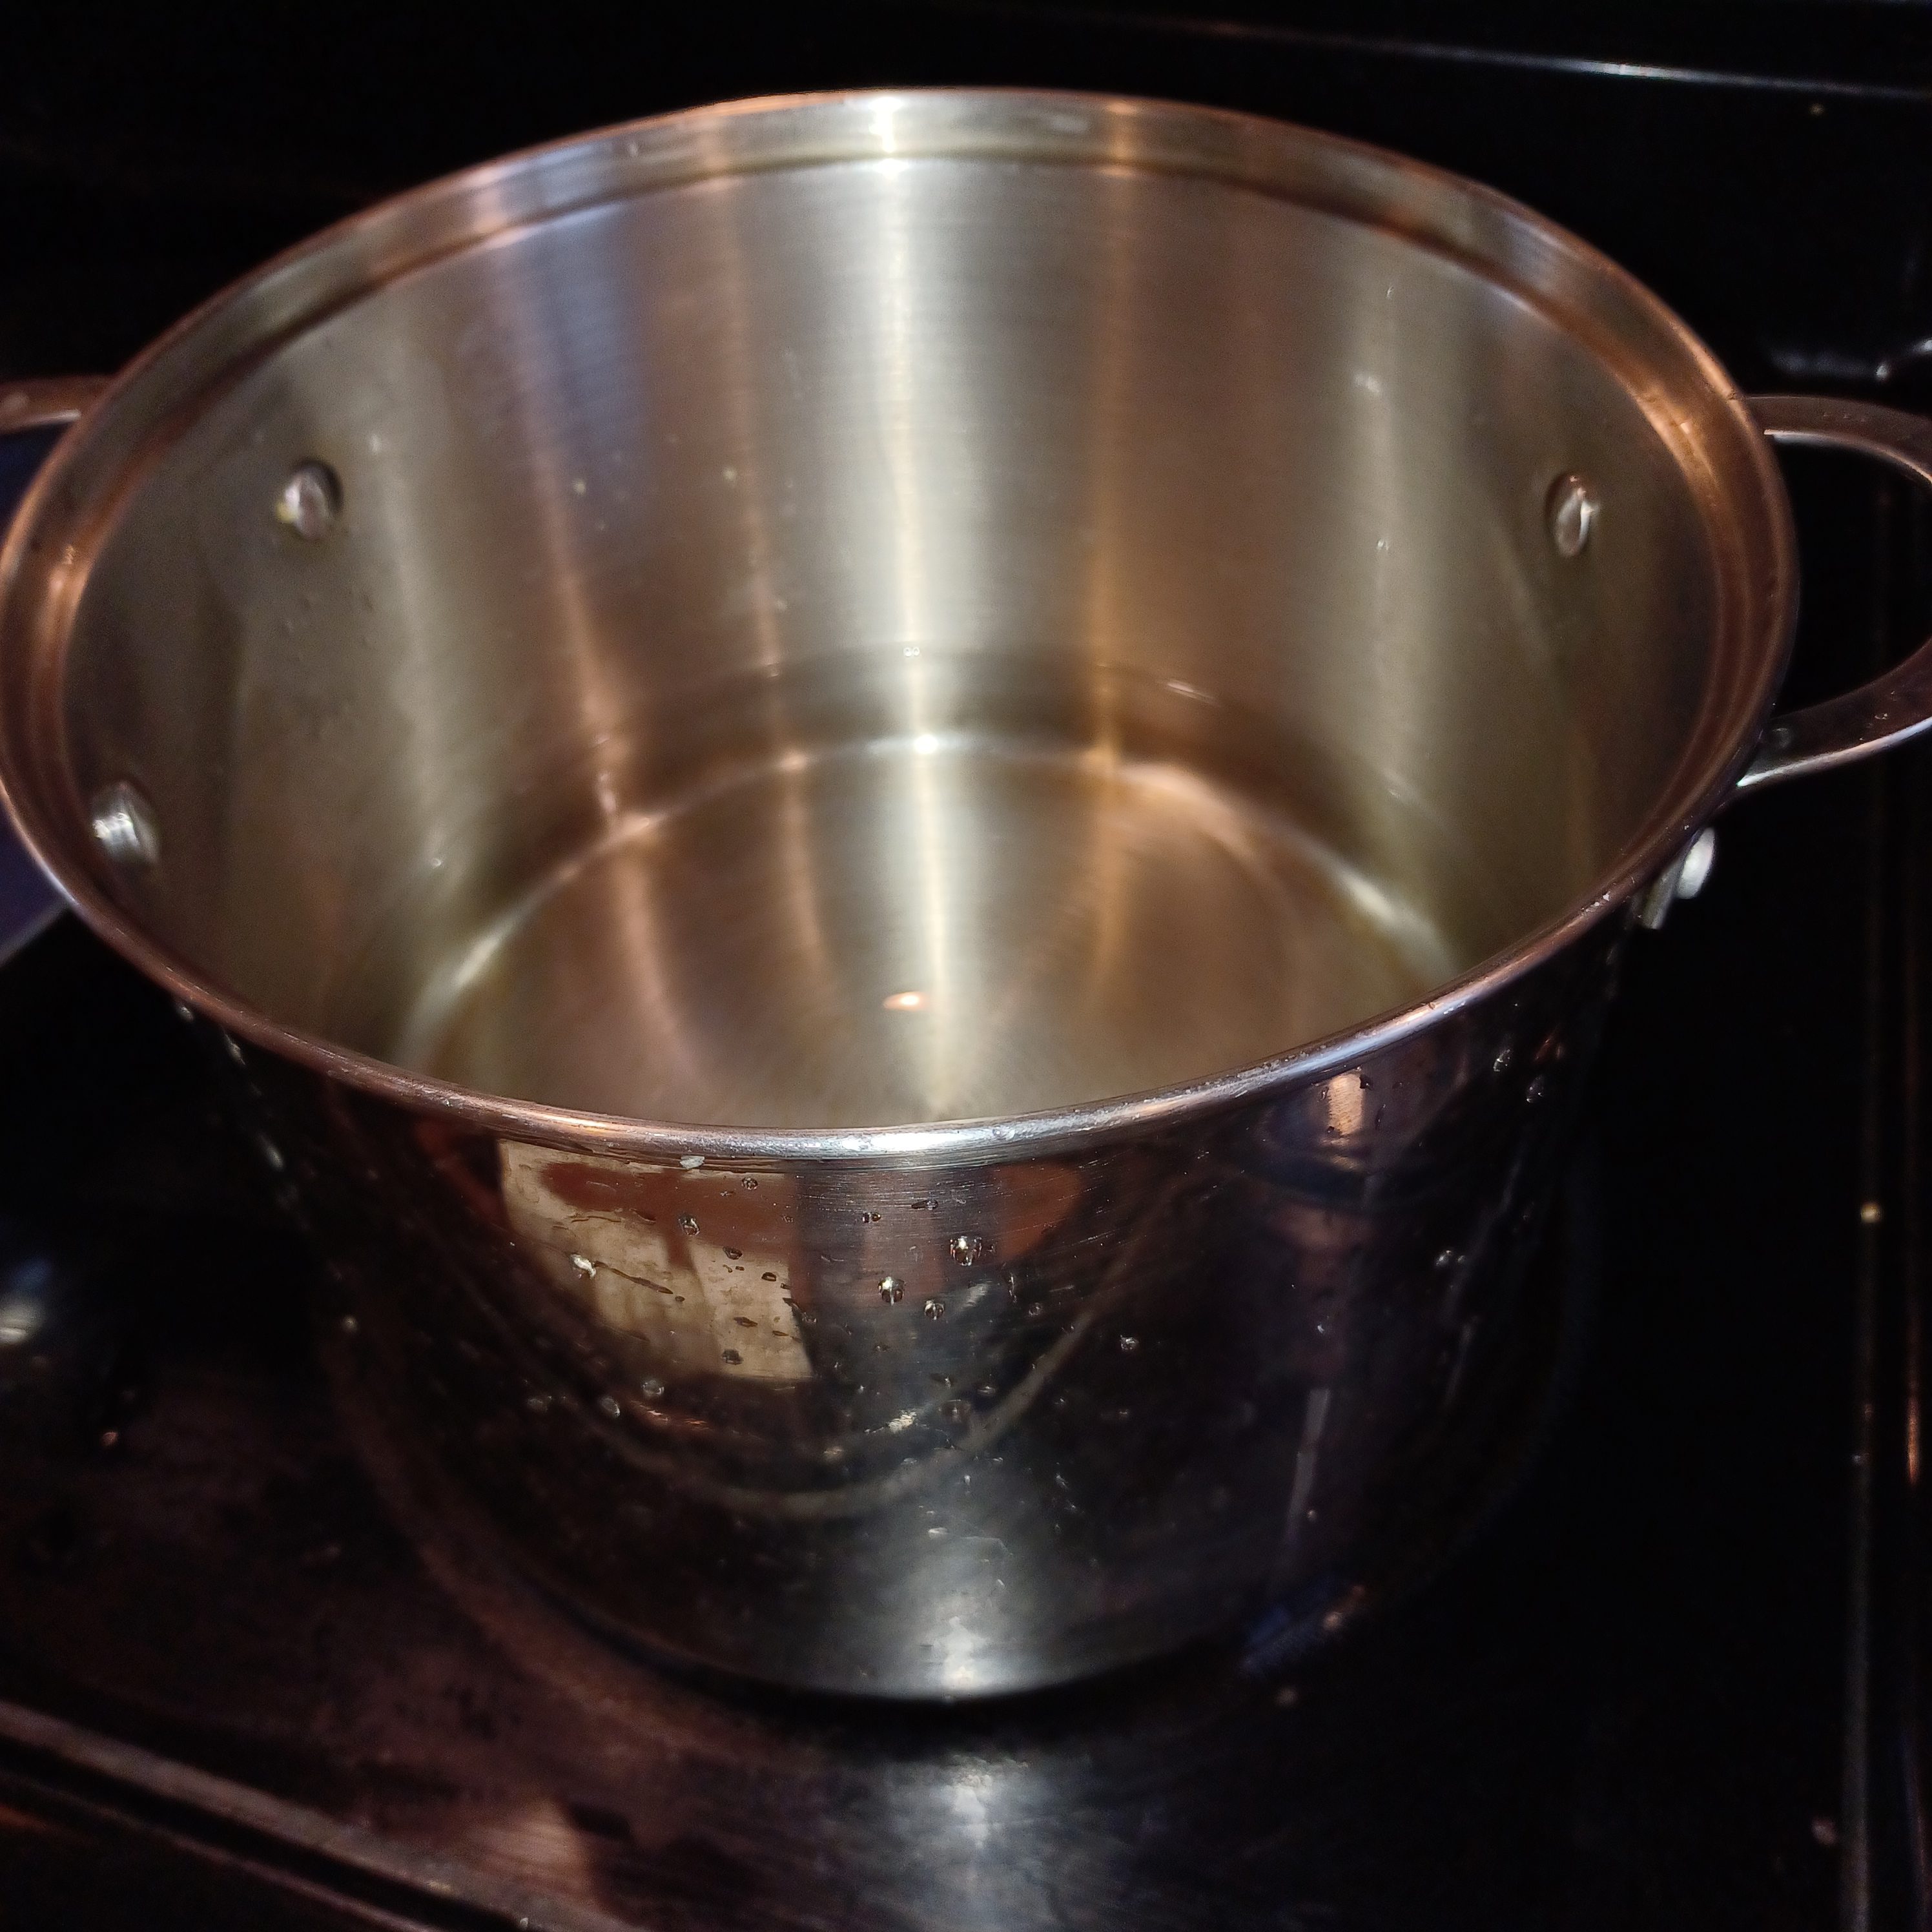
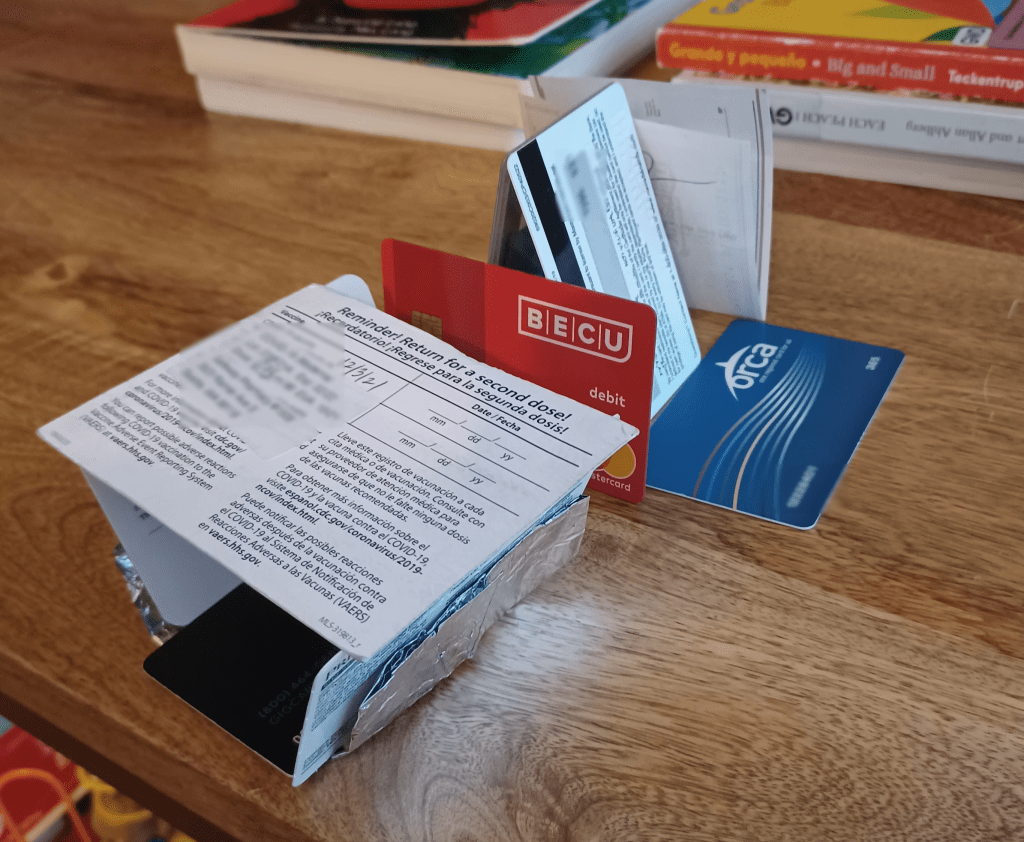
On a quiet night a few weeks ago, I found myself staring intently at a pot of water as it boiled, removing all the contents from my wallet, and then using them to build a rendering of my dream house.

Not what you did with your Tuesday night? Let me back up a bit and explain.

“A watched pot never boils”, my mom always said. This, it turns out, is false.

For as long as I can remember, I’ve understood that going running provided a sacred time when I could hear myself think. I let my mind wander, free of music or podcasts. I’ve thought through many big life decisions and transitions on runs.

These days, though, a few-times-a-week-run isn’t enough. I need more time than ever to slow down, process my life and the world around me, and just breathe.

So I was intrigued when I heard about the Bored and Brilliant project, a podcast-turned-book by the same name that explained “how spacing out can unlock your most productive and creative self.”

A little spacing out is good for the brain as well as the soul. Photo by mix909 on Unsplash

The idea is that getting away from distractions (particularly your phone) will give your brain space to be creative, problem solve, and plan your life, in ways you just don’t have space for when you are constantly being stimulated. The book culminates in a week-long finale of six daily challenges with the aim of getting you nice and bored.

I figured this could help me both personally and professionally and I was down for a challenge, but knew it would be more fun in community. I sent an email blast to a bunch of friends, and got a dozen or so to be curious enough to join me. I decided that I would send them one challenge a week for six weeks and would host three dinner parties over the course of the stint so we could share our experiences in real time.

Some challenges were not that hard: it turns out I’m not addicted to any apps. Some were fun: I learned some new Mexican slang by eavesdropping on a train full of soccer fans. Others had results I’d hoped for: not touching my phone while on the train really did lead to flashes of insight about problems at work. I could try this approach to my Power BI quandary! I forgot to control for this variable in my analysis!

Photo by No Revisions on Unsplash

But that challenge also surprised me. I found that I not only had more time to think about my own life, but I had more time to think about others. I would suddenly remember: My friend had a job interview. My mom had a doctors appointment. I should call and see how it went. I felt at once more introspective and more engaged with the world.

So back to that quiet night watching water boil and fishing credit cards out of my wallet. This was the culmination of the six-part challenge and it succeeded in getting me exorbitantly bored in order to set me up for a creative task: building my dream house. To be honest, I’m not that impressed with the dream house I concocted with mostly plastic cards found in my wallet. But I did get a lot of thinking done while watching for signs of the slightest bubble rising from the bottom of the pan.

My wallet-derived dream house. Numbers have been blurred out.

That was enough to convince me that boredom is going to be a regular part of my life from now on. When I find myself with too much stuff in my head, the solution may not be yet another productivity app, but time to just space out and let my brain do what it knows how to do in the background.

Why am I writing about this here? Because creativity and problem solving are skills we all need, and not the least in data professions. These skills make our work more fulfilling, and they set us apart from the Robots Coming For Our Jobs. Machines can crunch numbers, but humans decide which numbers need to be crunched to answer the question at hand and, more broadly, if that question is even the right one to be asking. If you’re feeling stumped, a little boredom may also be just what you need to get that spark of insight on how to approach the problem differently.

I challenge others to engage with this project either by reading Bored and Brilliant: How Spacing Out Can Unlock Your Most Productive and Creative Self by Manoush Zomorodi, or cut straight to the challenges with the more pithy WNYC podcast, hosted by the same author.

Let me know how it goes!

The Geometric Distribution Applied to Transit

“I need math assistance!”

Few words make me more willing to drop everything else I’m doing at work and hear out a colleague’s problems. Recently that is exactly the Teams chat I received at 4:43 pm.

“I live for these moments,” I responded, only half-joking.

The problem was this: If we know that our fare checkers ask x percent of light rail passengers each day for proof that they paid their fare, how long would a passenger expect to ride before they get fare checked?

Photo by Roman Fox on Unsplash
Approaching the Problem

Here’s a way to think about this problem. Let’s say we know that on any given ride, you have a 3% chance of getting fare-checked. That means that you have a 97% chance of not getting fare checked. So after one ride, there’s a 97% chance that you have never encountered a fare checker.

Now you ride a second time. You again have a 97% chance of not encountering a fare checker on this particular ride (and every ride thereafter). So your chance of not encountering a fare checker either your first or second time is now 97% times 97%, or 94.1%. Intuitively, this number will go down the more you ride: It’s easy to go one ride without getting checked, but it’s a lot harder to go 10 or 50 rides.

What I’m wanting to know here is at what point those odds go down to 50%. At what point would it start to be a little remarkable that I have ridden a lot and still not seen a fare checker?

The Long Way

You can do this manually in Excel pretty simply and it may help you to grasp what is happening here. You are taking the chance of not seeing a fare checker and raising it to the power of how many times you have ridden.

Table by author

If you continue this down a few more rows, you’ll see that it reaches 0.5 between the 22nd and 23rd ride. That’s a long time! Here’s that in a more visual form. You can see the plot crossing the y = 0.5 line at around x = 22.

Graph by author

In statistics, these numbers can be generated by the geometric distribution. Given a probability x of a given event (such as probability 0.03 of getting fare checked on any given ride), the geometric distribution can tell you how many trials you would expect to take before the event happens. It can also tell you how many M&Ms you would eat before finding one that is disfigured or how many clovers you would look through before finding one that has four leaves, as long as you know how often those things happen overall. Critically, these have to be independent events where the chance of it happening is always the same. In this example, my chance of getting fare checked on any given ride does not waver. It is always 3%, whether I just got fare checked this morning or haven’t been checked in a year. Yesterday’s events don’t affect today’s.

Photo by SHOT on Unsplash
The short way

I’m always a fan of doing something the long way the first time so I really get it. But when you’re ready to save time, you can solve this problem in R more quickly and succinctly using the qgeom function. My inputs are 0.5 (because I am interested in when my odds of never encountering a fare checker get down to 50%) and .03, my chance of encountering a fare checker on any given ride.

qgeom(.5, .03)
#given a 3% chance of getting fare checked on every ride, how long can I expect to ride before getting fare checked?
view raw Fare_checks.R hosted with ❤ by GitHub

The resulting 22 matches what we got in Excel: Given a 3% fare checking rate, I could ride 22 times and there would still be a 50% chance that I would never have encountered a fare checker.

By changing the 0.03 in the above code to something else, I can also quickly model how this would change if fare checks ramped up or down. For example, if policies changed and 10% of people were checked on any given day, then I’d expect to see a fare checker a lot sooner (after only 6 rides, in fact).

So, how much does the check rate matter? If you want people to feel like there’s a reasonable chance they’ll get checked, then increasing your check rate helps, but there are diminishing returns: it makes a big difference to go from a very low to low rate of fare checking, but it matters less to go from a high to very high rate. Here’s how long you’d expect to go before getting checked given different fare check rates.

x = seq(0.01, 1, by = 0.01)
y = qgeom(.5, x)
df = data.frame(x, y)
library(ggplot2)
ggplot(df, aes(x = x, y = y)) + geom_point() +
labs(x='Fare Check Rate', y='Rides Until Fare Check')
view raw fare checks 2.R hosted with ❤ by GitHub

So going from a 1% to 3% rate dramatically cuts down on the number of times I can expect to ride before getting fare checked. Going from 25 to 28% has nowhere near the same effect.

But wait…

You might be wondering: If I I have a 1% chance of getting checked on a given trip (meaning I get checked one in every 100 trips), then wouldn’t I just expect to go 50 trips before my first encounter, since that is half of 100? Why does the graph above tell me it’s over 60?

The reason that the answer is 68 rides and not 50 in that scenario is that seeing a fare checker on any given ride is an independent event. The fact that I got checked yesterday in no way makes me more or less likely to get checked today. In fact, I could in theory ride my whole life and by extreme luck, never get fare checked.

Compare that to something like guessing the code on a combination lock.

If there are 100 possible combinations and you start guessing them in order, then eventually you will have to find the combination. Each time you guess incorrectly, your chance of being correct the next time increases because there are fewer options left. So you would expect, on average, to find the combination after 50 tries on average and you are guaranteed to take 100 tries or less. Not so with an independent event like a fare check.

You can use the geometric distribution to model other independent events in transportation (if assumptions are met), such as: counting users of a bike trail until you find someone on an e-bike; number of days before a bus’s windshield gets chipped; or number of flights before a passenger’s luggage gets lost.

I hope you enjoy using the geometric distribution and qgeom to explore probability!

Prepare Well for your First Side Project

A while ago I finished my first big personal data science project with Python, where I applied what I was learning to a real question I had. Well, it may never be completely finished, but at some point I realized you have to decide you’ve done more or less what you set out to do, and move on. It was a rewarding experience and I wanted to offer up some reflections for others who might be thinking about embarking on their own side projects, to help you set yourself up for success.

Ask the Right Questions

Choose a question that you can find data for, and that interests you. Better yet, choose a question that will contribute something to your field. You’ll be spending a lot of time on this, so you might as well be invested in it.

Set Your Expectations

In the end, I spent much less time than I thought actually writing code and much more time troubleshooting, as I have mentioned before. This summarizes my expectations vs reality:

By author

(Of course, I created this in Python and the code is here.)

Choose the Right Tools

You’ll want to decide in what format you are going to keep your code and what tool you will use to code.

My first online Python course taught us to write code in a text editor, which worked well for class. Later, though, I spent a good deal of time being confused about what environments are because they were never explained. In short, to use libraries in Python (pre-made bits of code) you need to install the packages where those libraries live, but sometimes you want a newer version of a package and sometimes you may want an older version, because code changes with time. I did not fully appreciate how complicated it can be to figure this out and when I discovered Anaconda that made things much easier, because Anaconda is a package manager that helps you manage your environments for different projects.

Google Colab (screenshot by author)

I started out using a Jupyter notebook through Anaconda, but I still found myself getting frustrated by what sometimes seemed like an endless cycle of packages being dependent on other packages that I didn’t yet have. I switched to Google Colaboratory notebook, which has made my life much easier. It turns out, with the Colab you don’t have to worry about managing your environments, as it does this for you. It’s in the cloud, so you need a constant internet connection, and the process of importing or exporting files is different. But my code has examples of how to do this, and it’s well worth the short learning curve.

Build Your Support Network

You are going to spend a lot of time looking for help or diving deeper into a topic, and in time you’ll figure out what resources you like best. Stay open to different sites, blogs, or even books until you figure out what speaks to you. I tend to like what I read on Geeks for Geeks, so when I google a topic I don’t understand well and a Geeks for Geeks answer comes up, that’s usually the first one I click on, even if it’s halfway down the page. I’ve just learned that the way they explain things makes sense to me. I’ve also found good content on Programiz. Find something that resonates with you, because the learning never ends.

Photo by Neil Thomas on Unsplash

Revise and Repeat

Don’t delay too much in starting your first project. Rather than preparing until you think it’ll be perfect, get out there and start something. You will always have more to learn, so don’t let that stop you. But stay open to revisions and feedback from people who know more than you do. You can learn as much from others’ feedback as from any class, so be grateful for it.

I hope this is helpful as you start to think about trying out your own skills for the first time!