Or, if you’re just anti-social
When the pandemic started and everything was upended, I was curious how it was affecting people’s use of city parks. Anecdotally, I knew I was using them more than usual, because there wasn’t much else to do, and I still needed to exercise. It seemed like other people were too. I gathered data from a pedestrian and bicycle counter in Myrtle Edwards Park at the Seattle DOT’s website, and went to work (read more about the wonders of open data at my post here). Below is a no-code summary of what I found; you can view the whole Jupyter notebook of my Python code here.
First I did some basic apples-to-apples comparison of weekday activity in April 2020 compared to Aprils in past years.

What I found was nothing dramatic. April 2020 saw parks getting more usage than in most previous years, but less than in 2019. Perhaps covid had an impact, but perhaps population growth counteracted it. April 2020 was also unseasonably sunny, and in Seattle that really seems to bring people outside as well. I decided to try to determine what best accounted for those differences.
In addition to park usage data, added weather data from NOAA to my toolbox. As a side note: both the counter and the weather data were accessed via APIs. APIs allow you to access a continuous stream of data that updates every time you run your code, rather than having to download and import a new spreadsheet, for example. Here’s a decent explanation of APIs. This was helpful because I planned to incorporate new data as the pandemic unfolded.
Next, it was time to explore the distribution of the pedestrian and bike count data. This is an important step because many statistical analyses assume that the data is distributed somewhat normally; that is, a bell curve.
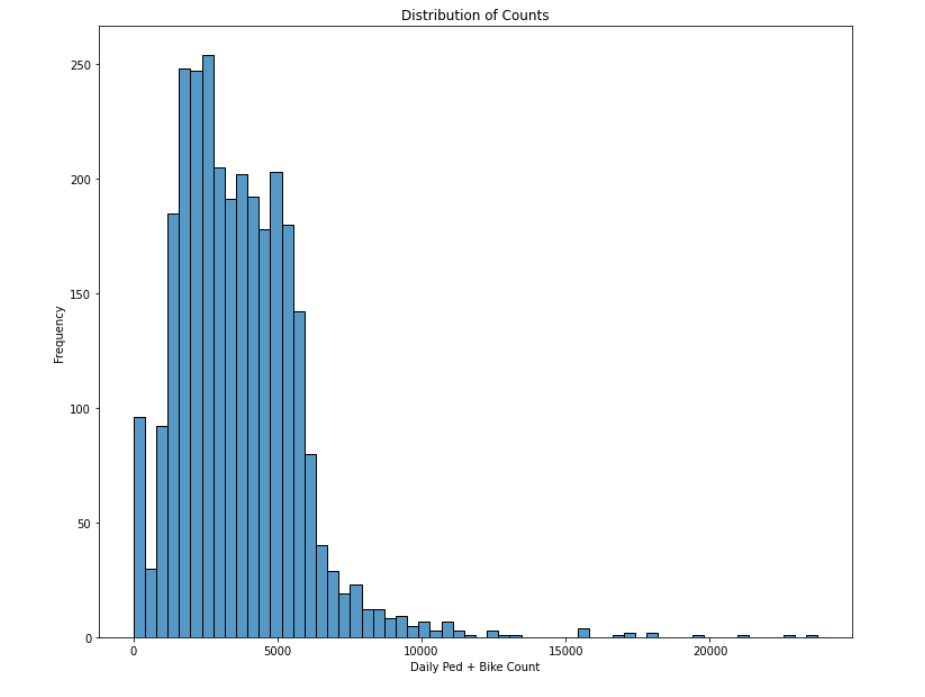
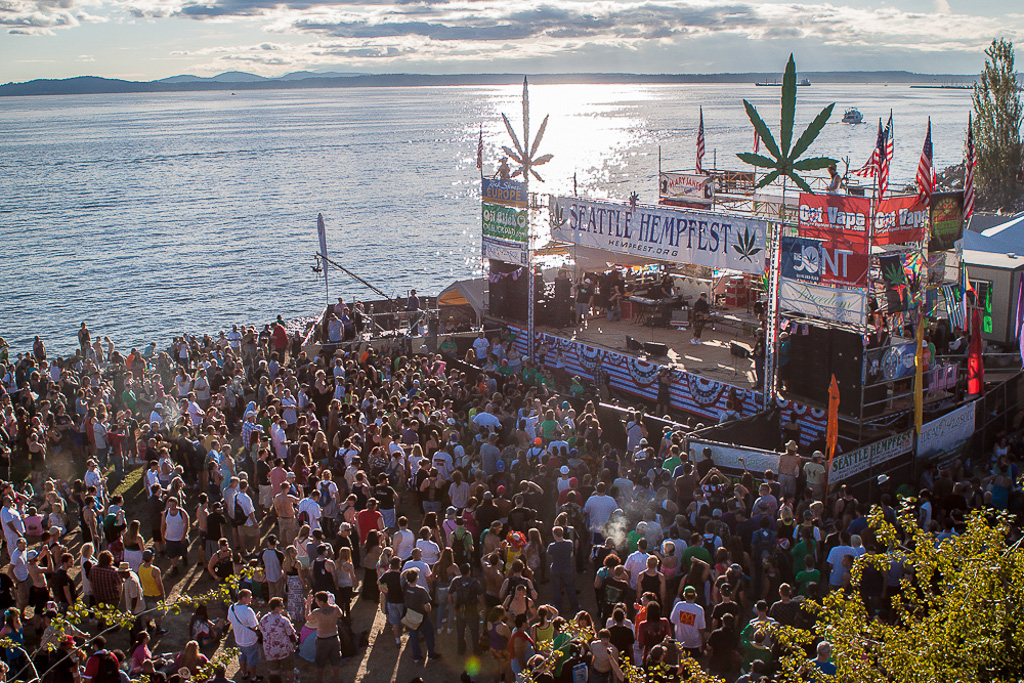
I noticed here that there were some extreme outliers. After some head-scratching, I figured out the dates coincided with the annual Hempfest event that happens at that park and brings thousands of marijuana lovers to the shores of Elliott Bay in a haze-filled celebration. I decided to mark those days, since they’re so anomalous, so I could account for them if I wanted to. Other than that, the data looked normal enough to me.
Using weather data, I added variables to the dataset for the high temperature of the day and whether it rained that day. I also added variables for whether the day was a weekend or holiday, and whether it occurred between March 2020 and June 2021, when vaccines became widely available.
One surprise was that being a weekend or holiday didn’t seem to make much of a difference at all, except for some outliers.
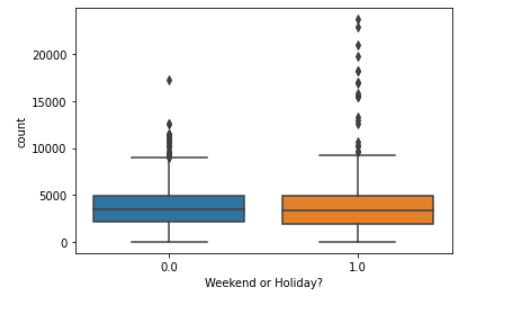
If weekends and holidays saw higher crowds at parks, we’d expect the orange box to be higher than the blue box, but really, they look very similar.
On the other hand, there is some difference in crowds during the pandemic, as we can see here where the orange box is higher than the blue box, but not by a wide margin.

Now I start trying to make a model that explains what accounts for differences in crowds. Here’s a scatterplot with daily high temperature and count, and a first attempt at linear regression:
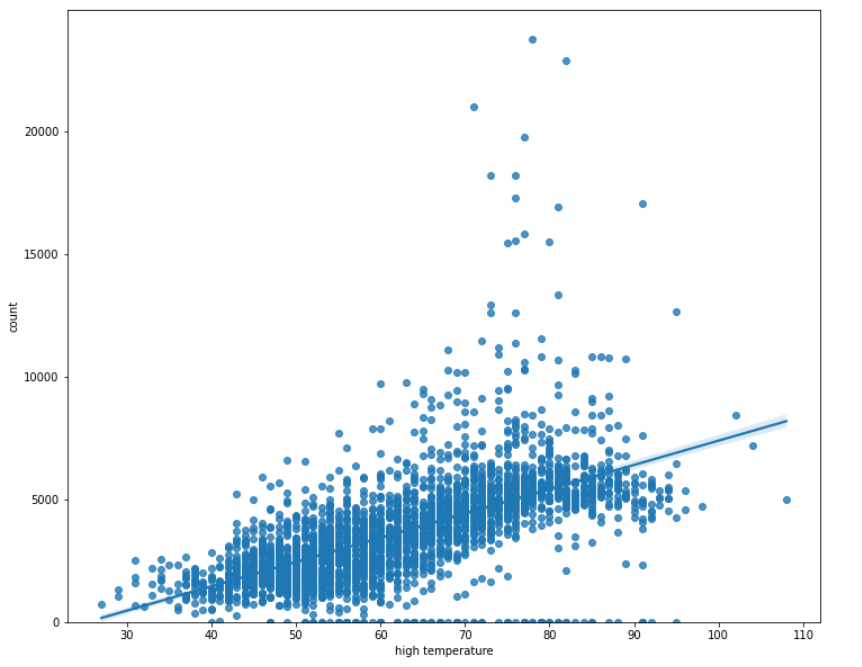
This model is ok, except for outliers, and temperatures above about 87 degrees. It makes sense – Seattleites start to get real hot and bothered after that point, and keep to the shade or the air-conditioned mall.
I played around with different models that accounted for different variables. Ultimately, the best model I found included these variables: high temperature, whether it rained that day, amount of precipitation, and whether it was a Hempfest day. The variables of whether it was during the pandemic or a weekend/holiday did not affect the model’s ability to predict park usage, so I left them out. The r-squared with this model was .56, which means that 56% of the variation in park usage can be explained by those four variables. The remaining 44% is due to variables I haven’t yet considered, and probably some random chance.
So there you have it, for now. If you want to social distance and/or generally avoid other people, go when it’s either cold-ish or very hot, raining or planning to rain, and definitely not during Hempfest, which happens in August.
When I get a chance, I’d like to expand on this analysis and look at interactions – such as if the temperature matters more or less when it’s supposed to rain, or if the pandemic made weekends more or less influential in park usage. For now, I’m just glad that I no longer feel the need to plan my life around social distancing, but have a few ideas on how to do it if I ever want to again.

One thought on “How To Avoid Park-Goers In a Pandemic”