I’ve mentioned it briefly before, but the open data tools offered by some local governments these days really are quite impressive. It’s a win-win situation: you get access to interesting data to explore, and cities might benefit if you develop an app or something useful to your fellow residents. Search for your own city here or have fun exploring some other cities’ open data systems. Here are a few worth highlighting:

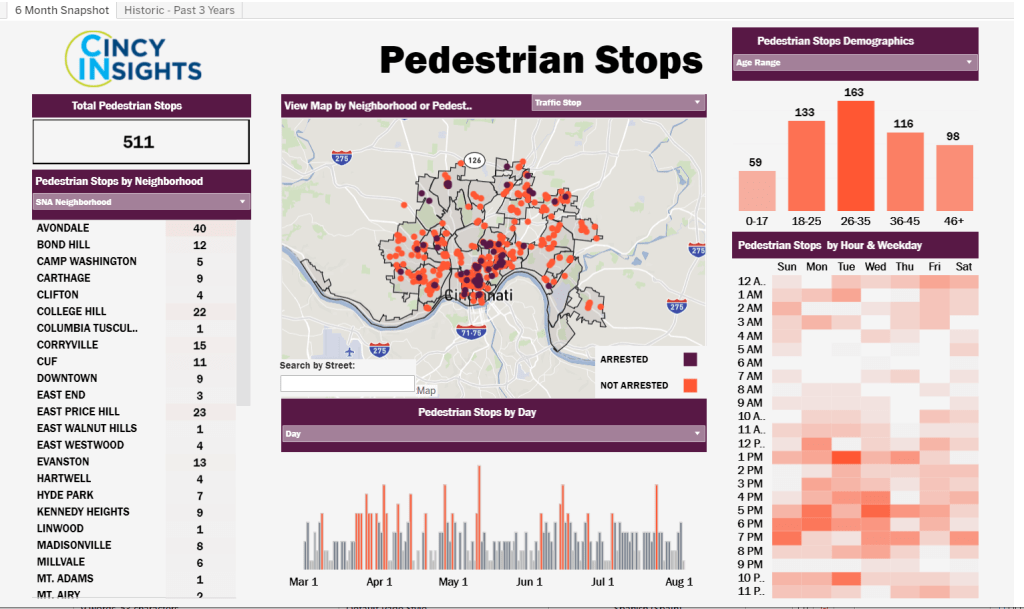
Ohio may not get much love from urbanist types like me, but it was on my mind because I just visited for the first time to see my husband’s hometown. While Cincy’s open data portal is not as well organized and searchable as some bigger cities, it has a lot of information if you know where to look. One that caught my eye is called PDI (Police Data Initiative) Pedestrian Stops. Police-pedestrian interaction is often overlooked by transportation planners but is so important, because we can’t get people out of cars if they don’t feel safe walking through their neighborhood without getting stopped and frisked.
The city provides an attractive dashboard to explore this dataset (click the image to open in a new window). You can also do your own analysis by accessing the raw data through the API or by downloading a CSV.
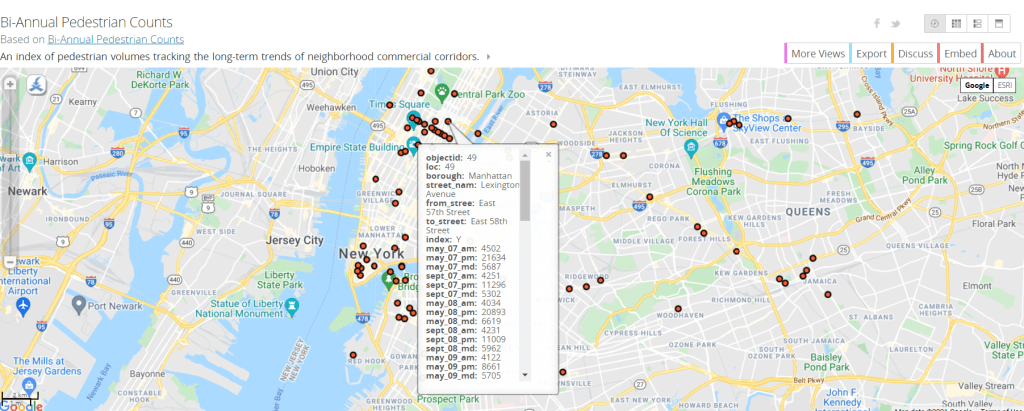
I’ll admit I’m a little partial to Gotham, having spent three memorable years there, but I know some see it as a little overrated. Still, their open data system stands out. New York City has robust spatial and tabular data on everything from taxi and limo driver registrations, pedestrian counts, and vehicle counts to the location of subway entrances and parking meters. And that’s just the transportation section! It would be interesting to pair one of the latter with data on crash rates in the neighborhood, for example, or demographics, to look for correlations. Most of the data can be exported into a shapefile for GIS analysis or into Excel. If you don’t have access to GIS, you can also export to a KMZ file and view it in Google MyMaps.

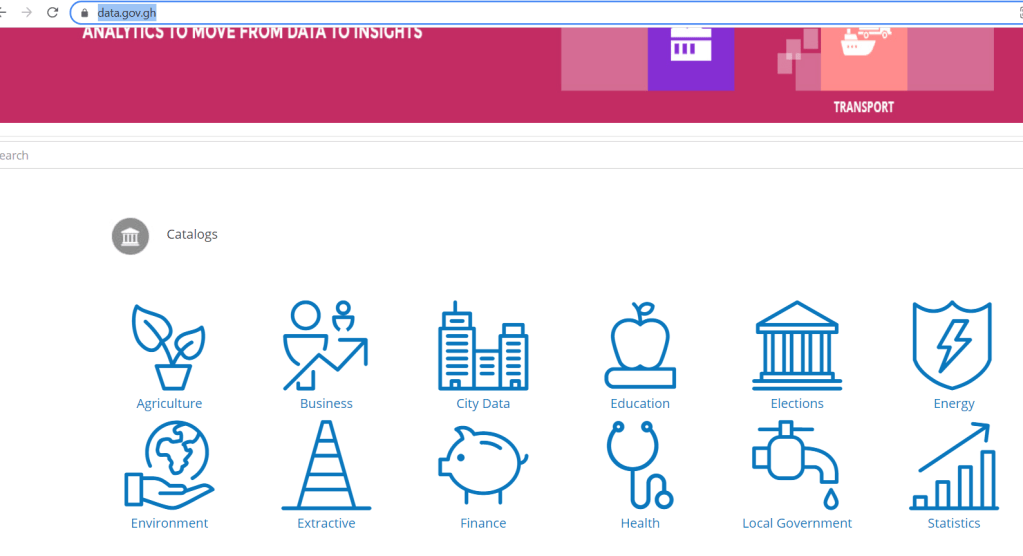
Add a pretty good open data initiative to this West African country’s list of assets, which already includes extraordinarily friendly people, fascinating history, and beaches with free-roaming wild boars. Their transport data focuses mostly on road fatalities, which sadly cause a disproportionate number of deaths in low- and middle-income countries. The data is quite detailed and tabulates by demographic, region, and road type, among other factors. As with the other cities, there’s lots here on finance, health, and development too, if that is more your style.
I hope that sparks your interest enough to go out and start exploring this open data yourself. Let me know what you find!

One thought on “Transportation Data Tools #3: Open Data Portals”